Plug-in San Diego Electric Vehicle Charging Stations Map Help
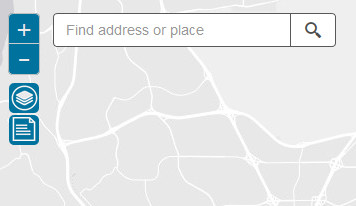
1- Navigation: This functionality provides users with the ability to change the map extent, zoom level, and underlying basemap. Additionally, users can search for a location by address or place name.
2- View Electric Vehicle Trip Ends: View areas with high concentrations of potential work-related EV trip ends by year.
3- Overlay Map Layers: Add additional layers to the map related to infrastructure, social equity, and reference.
4- More Information:Get detailed information on data sources and methodology
5- Glossary: Get defintions for terms used in the application.
There are several ways focus the map on an area of interest or change the map background.
Zoom/Pan: Use your mouse (double left-click or scroll wheel), keypad ("+" and "-" keys), or the zoom tool in the upper left hand corner to zoom in/out. To pan the map, left-click and drag using the mouse or press the arrow keys on the keypad. Zoom levels are limited to the San Diego Region at the lowest and neigborhood at the highest (the "+" or "-" buttons on the zoom tool will turn white once the maximum or minumum levels are reached.)

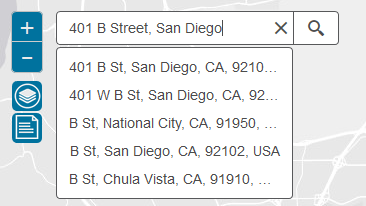
Search by Location:Type an address, place name, ZIP Code, or landmark in the search tool in the upper left-hand corner. The tool will provide suggestions as you type. Select one of the options or press enter to zoom the location.

Change Basemap: To change the map shown in the background, click on the map layer icon in the upper left-hand corner just below the zoom buttons and select one of the maps from the menu (click the icon again to collapse the menu). Four options are available:
Gray: Muted basemap designed to emphasize overlaid map layers
Topographic: Detailed reference map
Imagery: 2017 San Diego Regional aerial imagery
SanGIS Basemap: Detailed reference map created using SanGIS data
View EV trip end patterns for specific years and explore individual areas.
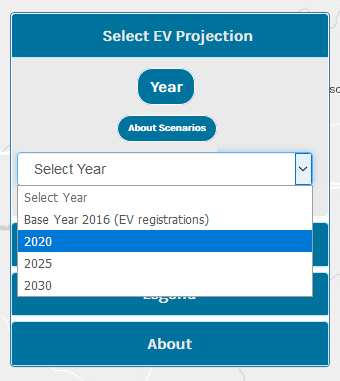
Select Year: To view potential EV trip ends by percentile, click on the Select EV Projection panel in the upper right-hand corner. Once the panel is expanded, select a year from the drop-down menu to load the layer on the map. 2016 base year as well 2020, 2025, and 2030 projections are available as options and can be changed at any time. Areas will be shaded from lowest to highest percentile of potential EV trip ends in light to dark green. The Legend panel can be expanded for reference.

EV Scenarios: To view information about the number of potential EV Trip Ends, Trip End Percentile (all years) and Nearby Charging Ports and Potential Trip End to Port Ratio (projected years only) for individual areas, left click on a shaded polygon to view a popup window. For projected years Potential Trip Ends will be displayed for three scenarios:
Low: Counts produced by the California Air Resources Board's EMission FACtors (EMFAC) model for future years based on an estimated regulatory path for meeting California emission rules, not actual sales. It should be noted that in 2030 EMFAC EV counts are higher than the figures based on sales trends in the Medium scenario.
Medium: Projected Future EV sales based on trends from sales data over the previous 6 years
High: Projected Future EV sales based on sales data over the previous 6 years, using an accelerated growth curve
To add additional layers to the map, click on the Overlays panel in the upper right-hand corner (below the Select an EV Scenario panel) to expand. Several maps layers are available and can be toggled on/off by checking or unchecking the box next to the layer name. Visible layers will appear in the legend, which can be expanding by clicking the Legend panel just below the Overlays panel.
Charging Stations - Locations of publicly accessible EV charging infrastructure. When visible, clicking on a charging station activates a popup with information about the number of ports by charger type. See Glossary for more details.
Park and Ride Lots - Locations of free public park and ride lots.
Disadvantaged Communities - Areas identified as having high environmental burdens and socioeconomic vulnerability. See Glossary for more details.
Benefit Accruing Areas - Areas with high proportion of automobile-based work trips originating from Disadvantaged Communities. See Glossary for a more details.
City Boundaries - Boundaries for the municipalities (18 cities and unincorporated County of San Diego) in the San Diego Region.
Community Planning Areas - Planning area boundaries within the City of San Diego and unincorporated County of San Diego.
To view more information about this application, expand the About panel in the upper right-hand corner (below the Legend panel).
Click on the View Legal Notice button for information on this document as it relates to California Energy Commission funding (or see below), as well as a link to the SANDAG Map and GIS Data Disclaimer.
This document was prepared as the result of work sponsored by the California Energy Commission. It does not necessarily represent the views of the Energy Commission, its employees, or the State of California. The Energy Commission, the State of California, its employees, contractors, and subcontractors make no warranty, express or implied, and assume no legal liability for the information in this document; nor does any party represent that the uses of this information will not infringe upon privately owned rights.
The methodology for calculating potential EV trip ends can be briefly summarized as follows:
- Disaggregate EV registration data to home Traffic Analysis Zones (TAZs)
- Identify work destination TAZs for trips originating from the home TAZs using output from the SANDAG Activity Based Travel Model (ABM)
- Proportionally spread potential EV work trip ends to destination TAZs based on number of work trips and EV registrations
Click on the Methodology button to open a PDF doument in a new window that describes this project and the related data development in detail.
To learn more about this program, click here or on the logo at the top of the page.
Terms commonly used in this application.
EV: Electric Vehicle
Traffic Analysis Zone (TAZ):
Small unit of geography in which trip origins and destinations are summarized by the SANDAG Activity Based Travel Model (ABM). There are approximately 5,000 TAZs in the San Diego Region.
EV work trip end:
Destination of trip taken via electric vehicle where the primary purpose of travel is commuting to work.
Potential EV work trip ends:
Sum of the share of EV work trip ends for a particular TAZ. This is a fractional figure as EV trip ends were assigned to destination TAZs in proportion to the number of work trips from the corresponding origin TAZs. The number of EVs in a home TAZ was divided equally among the number of automobile-based work trips originating from that TAZ, then summed by destination TAZ to arrive at trip end probability.
EV trip end percentile:
Rank of TAZ by potential EV work trip ends relative to all other TAZs in the region.
Disadvantaged Communities (DACs):
Census Tracts identified by Office of Environmental Health Hazard Assessment's (OEHHA) California Communities Environmental Health Screening Tool (CalEnviroScreen version 3.0) as has having high environmental burdens and socio-economic vulnerability. 25 percent of proceeds from the Greenhouse Gas Reduction Fund are required to be spent on projects located within DACs.
Benefit Accruing Areas (BAAs):
Areas with a high percentage of automobile-based trips ends from DACs where the primary purpose of travel is work. Although these zones may be outside of DACs, EV charging infrastructure in these zones has the potential to benefit DAC commuters who may have limited home charging options.
Charging stations:
Point location of publicly accessible charging infrastructure with some combination of Level 1, Level 2, and/or DC Fast ports. Data source: U.S. Department of Energy's Alternative Fuels Data Center.